Picture Graphs Board Game
Ages 5–8 · 4 minutes · Math
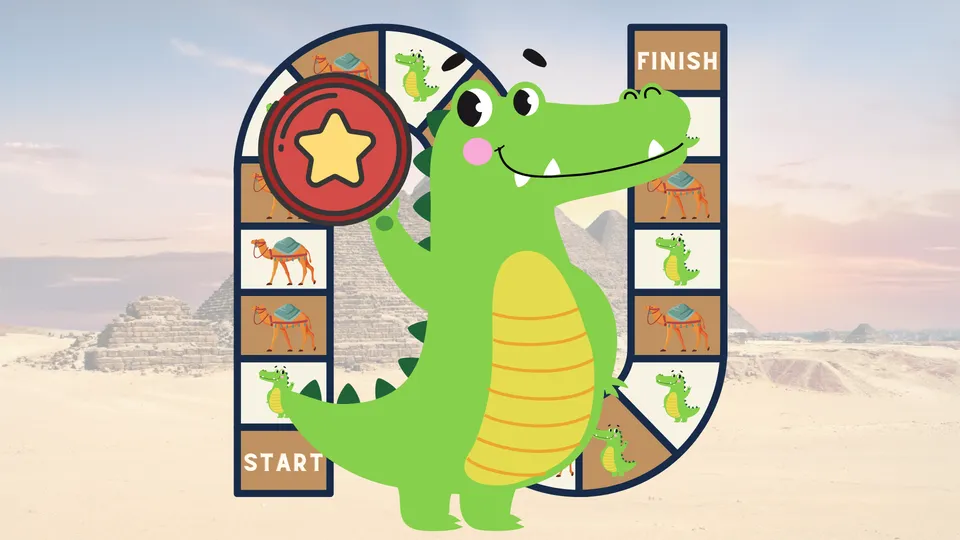
Collect as many crocodiles in your picture graph as you can!
Students can play this game to improve their understanding of picture graphs.
Choose a number from one to five to move the token and collect an animal. The picture graph gets updated automatically. To win, you must to collect more crocodiles than the teacher collects camels.
Part of
Standards alignment
Common Core State Standards
- 2.MD.D.10 — Draw a picture graph and a bar graph (with single-unit scale) to represent a data set with up to four categories. Solve simple put-together, take-apart, and compare problems using information presented in a bar graph.
Alabama
- MA19.1.16 — Organize, represent, and interpret data with up to three categories.
- MA19.1.16b — Summarize data on Venn diagrams, pictographs, and "yes-no" charts using real objects, symbolic representations, or pictorial representations.
- MA19.2.16 — Create a picture graph and bar graph to represent data with up to four categories.
- MA19.K.6 — Orally identify whether the number of objects in one group is _greater/more than, less/fewer than_, or _equal/the same as_ the number of objects in another group, in groups containing up to 10 objects, by using matching, counting, or other strategies.
Alaska
- 1.MD.7 — Organize, represent and interpret data with up to three categories. Ask and answer comparison and quantity questions about the data.
- K.CC.6 — Identify whether the number of objects in one group is greater than, less than, or equal to the number of objects in another group (e.g., by using matching, counting, or estimating strategies).
- 2.MD.9 — Collect, record, interpret, represent, and describe data in a table, graph or line plot.
Arizona
- 1.MD.C.4 — Organize, represent, and interpret data with up to three categories; ask and answer questions about the total number of data points, how many in each category, and how many more or less are in one category than in another.
- 2.MD.D.10 — Draw a picture graph and a bar graph (with single-unit scale) to represent a data set with up to four categories. Solve simple put-together, take-apart, and compare problems using information presented in a bar graph.
- K.CC.C.6 — Identify whether the number of objects in one group is greater than, less than, or equal to the number of objects in another group, e.g., by using matching and counting strategies.
Arkansas
- K.DA.1 — Collect, sort, and organize data into two or three categories, using real-object graphs and picture graphs.
- 1.DA.1 — Organize, represent, and interpret data with up to three categories (e.g., tally tables, picture graphs, bar graphs).
- 2.DA.2 — Ask and answer simple put together, take apart, and compare problems, using information presented in the bar graphs, picture graphs, and line plots.
California
- 1.MD.C.4 — Organize, represent, and interpret data with up to three categories; ask and answer questions about the total number of data points, how many in each category, and how many more or less are in one category than in another.
- 2.MD.D.10 — Draw a picture graph and a bar graph (with single-unit scale) to represent a data set with up to four categories. Solve simple put-together, take-apart, and compare problems using information presented in a bar graph.
- K.CC.C.6 — Identify whether the number of objects in one group is greater than, less than, or equal to the number of objects in another group, e.g., by using matching and counting strategies.
Colorado
- 1.MD.C.4 — Organize, represent, and interpret data with up to three categories; ask and answer questions about the total number of data points, how many in each category, and how many more or less are in one category than in another.
- 2.MD.D.10 — Draw a picture graph and a bar graph (with single-unit scale) to represent a data set with up to four categories. Solve simple put-together, take-apart, and compare problems (see Appendix, Table 1) using information presented in a bar graph.
- K.CC.C.6 — Identify whether the number of objects in one group is greater than, less than, or equal to the number of objects in another group, e.g., by using matching and counting strategies. (Include groups with up to 10 objects.)
Connecticut
- 1.MD.C.4 — Organize, represent, and interpret data with up to three categories; ask and answer questions about the total number of data points, how many in each category, and how many more or less are in one category than in another.
- 2.MD.D.10 — Draw a picture graph and a bar graph (with single-unit scale) to represent a data set with up to four categories. Solve simple put-together, take-apart, and compare problems using information presented in a bar graph.
- K.CC.C.6 — Identify whether the number of objects in one group is greater than, less than, or equal to the number of objects in another group, e.g., by using matching and counting strategies.
Delaware
- 1.MD.C.4 — Organize, represent, and interpret data with up to three categories; ask and answer questions about the total number of data points, how many in each category, and how many more or less are in one category than in another.
- 2.MD.D.10 — Draw a picture graph and a bar graph (with single-unit scale) to represent a data set with up to four categories. Solve simple put-together, take-apart, and compare problems using information presented in a bar graph.
- K.CC.C.6 — Identify whether the number of objects in one group is greater than, less than, or equal to the number of objects in another group, e.g., by using matching and counting strategies.
Florida
- MA.1.DP.1.1 — Collect data into categories and represent the results using tally marks or pictographs.
- MA.1.DP.1.2 — Interpret data represented with tally marks or pictographs by calculating the total number of data points and comparing the totals of different categories.
- MA.K.DP.1.1 — Collect and sort objects into categories and compare the categories by counting the objects in each category. Report the results verbally, with a written numeral or with drawings.
Georgia
- 1.MDR.6.4 — Ask questions and answer them based on gathered information, observations, and appropriate graphical displays to compare and order whole numbers.
- K.MDR.7.2 — Classify and sort up to ten objects into categories by an attribute; count the number of objects in each category and sort the categories by count.
- K.MDR.7.3 — Ask questions and answer them based on gathered information, observations, and appropriate graphical displays to solve problems relevant to everyday life.
- K.NR.4.2 — Compare two sets of up to 10 objects and identify whether the number of objects in one group is more or less than the other group, using the words “greater than,” “less than,” or “the same as”.
Hawaii
- 1.MD.C.4 — Organize, represent, and interpret data with up to three categories; ask and answer questions about the total number of data points, how many in each category, and how many more or less are in one category than in another.
- 2.MD.D.10 — Draw a picture graph and a bar graph (with single-unit scale) to represent a data set with up to four categories. Solve simple put-together, take-apart, and compare problems using information presented in a bar graph.
- K.CC.C.6 — Identify whether the number of objects in one group is greater than, less than, or equal to the number of objects in another group, e.g., by using matching and counting strategies.
Idaho
- 1.MD.C.4 — Organize, represent, and interpret data with up to three categories; ask and answer questions about the total number of data points, how many in each category, and how many more or less are in one category than in another.
- 2.MD.D.10 — Draw a picture graph and a bar graph (with single-unit scale) to represent a data set with up to four categories. Solve simple put-together, take-apart, and compare problems using information presented in the graph.
- K.CC.C.6 — Identify whether the number of objects in one group is greater than, less than, or equal to the number of objects in another group for groups with up to ten objects.
Illinois
- 1.MD.C.4 — Organize, represent, and interpret data with up to three categories; ask and answer questions about the total number of data points, how many in each category, and how many more or less are in one category than in another.
- 2.MD.D.10 — Draw a picture graph and a bar graph (with single-unit scale) to represent a data set with up to four categories. Solve simple put-together, take-apart, and compare problems using information presented in a bar graph.
- K.CC.C.6 — Identify whether the number of objects in one group is greater than, less than, or equal to the number of objects in another group, e.g., by using matching and counting strategies.
Indiana
- 1.DA.1 — With guidance, collect data from a simple survey or collaborative investigation; organize data into appropriate single-unit bar graphs, pictographs, and/or tables and draw conclusions based on mathematical observations, comparisons, and grade-level computation strategies. (E)
- K.DA.1 — With guidance, collect and organize data into simple bar graphs, pictographs, and/or tables to identify patterns and make comparisons. (E)
- K.NS.5 — Identify whether the number of objects in one group is greater than, less than, or equal to the number of objects in another group (e.g., by using matching and counting strategies).
Iowa
- 1.MD.C.4 — Organize, represent, and interpret data with up to three categories; ask and answer questions about the total number of data points, how many in each category, and how many more or less are in one category than in another.
- K.CC.C.6 — Determine whether the number of objects in one group of 1– 10 objects is greater than, less than, or equal to the number of objects in another group of 1–10 objects. For example, using matching and counting strategies.
Kansas
- 1.MD.4 — Organize, represent, and interpret data with up to three categories; ask and answer questions about the total number of data points, how many in each category, and how many more or less are in one category than in another.
- 2.MD.11 — Draw a picture graph and a bar graph (with single-unit scale) to represent a data set with up to four categories. Solve simple put-together, take-apart, and compare problems using information presented in a bar graph.
- K.CC.6 — Identify whether the number of objects in one group is greater than, less than, or equal to the number of objects in another group, (e.g. by using matching and counting strategies.) Include groups with up to ten objects.
Kentucky
- KY.2.MD.10 — Create a pictograph and a bar graph (with single-unit scale) to represent a data set with up to four categories. Solve simple put together, take-apart and compare problems using information presented in a bar graph.
- KY.1.MD.4.d — Interpret data to answer questions about the table/chart that connects to the question posed, including total number of data points, how many in each category and how many more or less are in one category than in another.
- KY.K.CC.6 — Identify whether the number of objects in one group is greater than, less than, or equal to the number of objects in another group.
Louisiana
- 1.MD.C.4 — Organize, represent, and interpret data with up to three categories; ask and answer questions about the total number of data points, how many in each category, and how many more or less are in one category than in another.
- 2.MD.D.10 — Draw a picture graph and a bar graph (with single-unit scale) to represent a data set with up to four categories. Solve simple put-together, take-apart, and compare problems using information presented in a bar graph.
- K.CC.C.6 — Identify whether the number of objects in one group is greater than, less than, or equal to the number of objects in another group, e.g., by using matching and counting strategies.
Maine
- 1.MD.C.4 — Organize, represent, and interpret data with up to three categories; ask and answer questions about the total number of data points, how many in each category, and how many more or less are in one category than in another.
- 2.MD.D.10 — Draw a picture graph and a bar graph (with single-unit scale) to represent a data set with up to four categories. Solve simple put-together, take-apart, and compare problems using information presented in a bar graph.
- K.CC.C.6 — Identify whether the number of objects in one group is greater than, less than, or equal to the number of objects in another group, e.g., by using matching and counting strategies. Include groups with up to ten objects.
Maryland
- 1.MD.C.4 — Organize, represent, and interpret data with up to three categories; ask and answer questions about the total number of data points, how many in each category, and how many more or less are in one category than in another.
- 2.MD.D.10 — Draw a picture graph and a bar graph (with single-unit scale) to represent a data set with up to four categories. Solve simple put-together, take-apart, and compare problems using information presented in a bar graph.
- K.CC.C.6 — Identify whether the number of objects in one group is greater than, less than, or equal to the number of objects in another group, e.g., by using matching and counting strategies.
Massachusetts
- 1.MD.C.4 — Organize, represent, and interpret data with up to three categories; ask and answer questions about the total number of data points, how many in each category, and how many more or less are in one category than in another.
- 2.MD.D.10 — Draw a picture graph and a bar graph (with single-unit scale) to represent a data set with up to four categories. Solve simple put-together, take-apart, and compare problems, using information presented in a bar graph.
- K.CC.C.6 — Identify whether the number of objects in one group is greater than, less than, or equal to the number of objects in another group for groups with up to 10 objects, e.g., by using matching and counting strategies.
Michigan
- 1.MD.C.4 — Organize, represent, and interpret data with up to three categories; ask and answer questions about the total number of data points, how many in each category, and how many more or less are in one category than in another.
- 2.MD.D.10 — Draw a picture graph and a bar graph (with single-unit scale) to represent a data set with up to four categories. Solve simple put-together, take-apart, and compare problems using information presented in a bar graph.
- K.CC.C.6 — Identify whether the number of objects in one group is greater than, less than, or equal to the number of objects in another group, e.g., by using matching and counting strategies.
Minnesota
- 1.1.1.7 — Use counting and comparison skills to create and analyze bar graphs and tally charts. For example: Make a bar graph of students' birthday months and count to compare the number in each month.
- K.1.1.2 — Read, write, and represent whole numbers from 0 to at least 31. Representations may include numerals, pictures, real objects and picture graphs, spoken words, and manipulatives such as connecting cubes. For example: Represent the number of students taking hot lunch with tally marks.
- K.1.1.5 — Compare and order whole numbers, with and without objects, from 0 to 20. For example: Put the number cards 7, 3, 19 and 12 in numerical order.
Mississippi
- 1.MD.4 — Organize, represent, and interpret data with up to three categories; ask and answer questions about the total number of data points, how many in each category, and how many more or less are in one category than in another.
- 2.MD.10 — Draw a picture graph and a bar graph (with single-unit scale) to represent a data set with up to four categories. Solve simple put-together, take-apart, and compare problems using information presented in a bar graph.
- K.CC.6 — Identify whether the number of objects in one group is greater than, less than, or equal to the number of objects in another group, e.g., by using matching and counting strategies.
Missouri
- 1.DS.A.2 — Draw conclusions from object graphs, picture graphs, T-charts and tallies.
- 2.DS.A.5 — Draw conclusions from line plots, picture graphs and bar graphs.
- 1.DS.A.1 — Collect, organize and represent data with up to three categories.
- 2.DS.A.4 — Solve problems using information presented in line plots, picture graphs and bar graphs.
Montana
- 1.MD.C.4 — Organize, represent, and interpret data with up to three categories; ask and answer questions about the total number of data points, how many in each category, and how many more or less are in one category than in another.
- 2.MD.D.10 — Draw a picture graph and a bar graph (with single-unit scale) to represent a data set from a variety of cultural contexts, including those of Montana American Indians, with up to four categories and solve simple put together, take-apart and compare problems using information presented in a bar graph.
- K.CC.C.6 — Identify whether the number of objects in one group is greater than, less than, or equal to the number of objects in another group, e.g., by using matching and counting strategies.
Nebraska
- 1.D.1.a — Collect, organize, and represent a data set with up to three categories using a picture graph.
- 1.D.2.a — Ask and answer questions about the total number of data points, how many in each category, and compare categories by identifying how many more or less are in a particular category using a picture graph.
- K.N.2.h — Compare the number of objects in two groups, up to 20, using the words fewer than, more than, the same as.
Nevada
- 1.MD.C.4 — Organize, represent, and interpret data with up to three categories; ask and answer questions about the total number of data points, how many in each category, and how many more or less are in one category than in another.
- 2.MD.D.10 — Draw a picture graph and a bar graph (with single-unit scale) to represent a data set with up to four categories. Solve simple put-together, take-apart, and compare problems using information presented in a bar graph.
- K.CC.C.6 — Identify whether the number of objects in one group is greater than, less than, or equal to the number of objects in another group, e.g., by using matching and counting strategies.
New Hampshire
- 1.MD.C.4 — Organize, represent, and interpret data with up to three categories; ask and answer questions about the total number of data points, how many in each category, and how many more or less are in one category than in another.
- 2.MD.D.10 — Draw a picture graph and a bar graph (with single-unit scale) to represent a data set with up to four categories. Solve simple put-together, take-apart, and compare problems using information presented in a bar graph.
- K.CC.C.6 — Identify whether the number of objects in one group is greater than, less than, or equal to the number of objects in another group, e.g., by using matching and counting strategies.
New Jersey
- 1.MD.C.4 — Organize, represent, and interpret data with up to three categories; ask and answer questions about the total number of data points, how many in each category, and how many more or less are in one category than in another.
- 2.MD.D.10 — Draw a picture graph and a bar graph (with single-unit scale) to represent a data set with up to four categories. Solve simple put together, take-apart, and compare problems using information presented in a bar graph.
- K.CC.C.6 — Identify whether the number of objects in one group is greater than, less than, or equal to the number of objects in another group, e.g., by using matching and counting strategies.
New Mexico
- 1.MD.C.4 — Organize, represent, and interpret data with up to three categories; ask and answer questions about the total number of data points, how many in each category, and how many more or less are in one category than in another.
- K.CC.C.6 — Identify whether the number of objects in one group is greater than, less than, or equal to the number of objects in another group, e.g., by using matching and counting strategies.
- 2.MD.D.10 — Draw a picture graph and a bar graph (with single-unit scale) to represent a data set with up to four categories. Solve simple put-together, take-apart, and compare problems using information presented in a bar graph.
New York
- NY-2.MD.10 — Draw a picture graph and a bar graph (with single-unit scale) to represent a data set with up to four categories. Solve simple put-together, take-apart, and compare problems using information presented in a picture graph or a bar graph.
- NY-1.MD.4 — Organize, represent, and interpret data with up to three categories; ask and answer questions about the total number of data points, how many in each category, and how many more or less are in one category than in another.
- NY-K.CC.6 — Identify whether the number of objects in one group is greater than (more than), less than (fewer than), or equal to (the same as) the number of objects in another group.
North Carolina
- NC.1.MD.4 — Organize, represent, and interpret data with up to three categories. • Ask and answer questions about the total number of data points. • Ask and answer questions about how many in each category. • Ask and answer questions about how many more or less are in one category than in another.
- NC.2.MD.10 — Organize, represent, and interpret data with up to four categories. • Draw a picture graph and a bar graph with a single-unit scale to represent a data set. • Solve simple put-together, take-apart, and compare problems using information presented in a picture and a bar graph.
- NC.K.CC.6 — Identify whether the number of objects, within 10, in one group is greater than, less than, or equal to the number of objects in another group, by using matching and counting strategies.
North Dakota
- 1.DPS.D.1 — Collect, organize, and represent data with up to three categories using picture and bar graphs.
- 1.DPS.D.2 — Analyze data by answering descriptive questions.
- 2.DPS.D.3 — Analyze data and interpret the results to solve one-step comparison problems using information from the graphs.
Ohio
- 2.MD.10 — Organize, represent, and interpret data with up to four categories; complete picture graphs when single-unit scales are provided; complete bar graphs when single-unit scales are provided; solve simple put-together, take-apart, and compare problems in a graph.
- 1.MD.4 — Organize, represent, and interpret data with up to three categories; ask and answer questions about the total number of data points, how many in each category, and how many more or less are in one category than in another.
- K.CC.6 — Orally identify (without using inequality symbols) whether the number of objects in one group is greater/more than, less/fewer than, or the same as the number of objects in another group, not to exceed 10 objects in each group.
Oklahoma
- K.D.1.3 — Draw conclusions from real-object graphs and pictographs.
- 1.D.1.2 — Use data to create pictographs and bar graphs that demonstrate one-to-one correspondence.
- 1.D.1.3 — Draw conclusions from pictographs and bar graphs.
- K.D.1.2 — Use categorical data to create real-object graphs and pictographs.
Oregon
- 1.DR.B.2 — Analyze data sets with up to three categories by representing data visually, such as with graphs and charts, and interpret information presented to answer investigative questions.
- 2.DR.B.2 — Analyze data with a single-unit scale and interpret information presented to answer investigative questions.
- K.NCC.C.6 — Identify whether the number of objects in one group is greater than, less than, or equal to the number of objects in another group.
- K.DR.B.2 — Analyze data sets by counting the number of objects in each category and interpret results by classifying and sorting objects by count.
Pennsylvania
- CC.2.4.2.A.4 — Represent and interpret data using line plots, picture graphs, and bar graphs.
- CC.2.4.1.A.4 — Represent and interpret data using tables/charts.
Rhode Island
- 1.MD.C.4 — Organize, represent, and interpret data with up to three categories; ask and answer questions about the total number of data points, how many in each category, and how many more or less are in one category than in another.
- 2.MD.D.10 — Draw a picture graph and a bar graph (with single-unit scale) to represent a data set with up to four categories. Solve simple put-together, take-apart, and compare problems using information presented in a bar graph.
- K.CC.C.6 — Identify whether the number of objects in one group is greater than, less than, or equal to the number of objects in another group for groups with up to 10 objects, e.g., by using matching and counting strategies.
- K.MD.B.3 — Classify objects into given categories; count the numbers of objects in each category (up to and including 10) and sort the categories by count.
South Carolina
- K.MDA.4 — Represent data using object and picture graphs and draw conclusions from the graphs.
- 1.MDA.4 — Collect, organize, and represent data with up to 3 categories using object graphs, picture graphs, t-charts and tallies.
- 1.MDA.5 — Draw conclusions from given object graphs, picture graphs, t-charts, tallies, and bar graphs.
- K.NS.7 — Determine whether the number of up to ten objects in one group is more than, less than, or equal to the number of up to ten objects in another group using matching and counting strategies.
South Dakota
- 1.MD.C.4 — Organize, represent, and interpret data with up to three categories; ask and answer questions about the total number of data points, how many in each category, and how many more or less are in one category than in another.
- 2.MD.D.10 — Draw a picture graph and a bar graph (with single-unit scale) to represent a data set with up to four categories. Solve simple put-together, take-apart, and compare problems using information presented in a bar graph.
- K.CC.C.6 — Identify whether the number of objects in one group is greater than, less than, or equal to the number of objects in another group. Include groups with up to ten objects.
Tennessee
- 1.MD.C.5 — Organize, represent, and interpret data with up to three categories using pictographs, bar graphs, and tally charts. Ask and answer questions about the total number of data points, how many in each category, and how many more or less are in one category than in another.
- 2.MD.D.10 — Draw a pictograph (with a key of values of 1, 2, 5, or 10) and a bar graph (with intervals of one) to represent a data set with up to four categories. Solve addition and subtraction problems related to the data in a graph.
- K.CC.C.7 — Identify whether the number of objects in one group is greater than, less than, or equal to the number of objects in another group.
Texas
- 1.8C — draw conclusions and generate and answer questions using information from picture and bar-type graphs.
- K.8B — use data to create real-object and picture graphs; and
- K.8C — draw conclusions from real-object and picture graphs.
- 1.8B — use data to create picture and bar-type graphs; and
Utah
- 2.MD.10 — Draw a picture graph and a bar graph (with single-unit scale) to represent a data set with up to four categories. Solve simple put-together, take-apart, and comparison problems using information presented in a bar graph.
- K.CC.6 — Use matching or counting strategies to identify whether the number of objects in one group is greater than, less than, or equal to the number of objects in another group. Include groups with up to ten objects.
Vermont
- 2.MD.D.10 — Draw a picture graph and a bar graph (with single-unit scale) to represent a data set with up to four categories. Solve simple put-together, take-apart, and compare problems using information presented in a bar graph.
Virginia
- K.PS.1g — Analyze data represented in object graphs and picture graphs and communicate results:
- 1.PS.1g — Analyze data represented in object graphs, picture graphs, and tables and communicate results:
- K.PS.1f — Organize and represent a data set (vertically or horizontally) using pictures to form a simple picture graph.
- 1.1.c.v — Read and interpret data displayed in tables, picture graphs, and object graphs, using the vocabulary more, less, fewer, greater than, less than, and equal to.
- 1.PS.1f — Represent a data set (vertically or horizontally) using object graphs, picture graphs, and tables.
Washington
- 1.MD.C.4 — Organize, represent, and interpret data with up to three categories; ask and answer questions about the total number of data points, how many in each category, and how many more or less are in one category than in another.
- 2.MD.D.10 — Draw a picture graph and a bar graph (with single-unit scale) to represent a data set with up to four categories. Solve simple put-together, take-apart, and compare problems using information presented in a bar graph.
- K.CC.C.6 — Identify whether the number of objects in one group is greater than, less than, or equal to the number of objects in another group, e.g., by using matching and counting strategies.
Washington, D.C.
- 1.MD.C.4 — Organize, represent, and interpret data with up to three categories; ask and answer questions about the total number of data points, how many in each category, and how many more or less are in one category than in another.
- 2.MD.D.10 — Draw a picture graph and a bar graph (with single-unit scale) to represent a data set with up to four categories. Solve simple put-together, take-apart, and compare problems using information presented in a bar graph.
- K.CC.C.6 — Identify whether the number of objects in one group is greater than, less than, or equal to the number of objects in another group, e.g., by using matching and counting strategies.
West Virginia
- M.1.19 — Organize, represent, interpret data with up to three categories; ask and answer questions about the total number of data points, how many in each category and how many more or less are in one category than in another.
- M.2.24 — Draw a picture graph and a bar graph (with single-unit scale) to represent a data set with up to four categories. Solve simple put-together, take-apart, and compare problems using information presented in a bar graph.
- M.K.6 — Identify whether the number of objects in one group is greater than, less than, or equal to the number of objects in another group (e.g., by using matching and counting strategies).
Wisconsin
- M.1.MD.C.4 — Organize, represent, and interpret data with up to three categories; ask and answer questions about the total number of data points, how many in each category, and how many more or less are in one category than in another.
- M.2.MD.D.10 — Draw a picture graph and a bar graph (with single-unit scale) to represent a data set with up to four categories. Solve simple put together, take-apart, and compare problems using information presented in a bar graph.
- M.K.CC.C.7 — Identify whether the number of objects (up to 10) in one group is greater than, less than, or equal to the number of objects in another group, e.g., by using matching and counting strategies.
Wyoming
- 1.MD.J.4 — Organize, represent, and interpret data with up to three categories; ask and answer questions about the total number of data points, how many in each category, and how many more or less are in one category than in another.
- 1.MD.J — Represent and interpret data.
- 2.MD.I.10.A — Draw a picture graph and a bar graph (with single-unit scale) to represent a data set with up to four categories.
- K.CC.C.6 — Identify whether the number of objects in one group is greater than, less than, or equal to the number of objects in another group. (Include groups with up to ten objects.)